The ostrich effect: why we bury our heads away from data
Have you ever avoided information that could help you make better decisions? Understanding why we sometimes choose not to know can help us design data visualizations that encourage people to engage with important insights.

Your aunt Beetrice has been diagnosed with a serious illness, let’s call it Purplitis, created by the overconsumption of beets, but she refuses to read any information about her condition*. She insists that she'd rather not know the details, even though this information could save her from Advanced Purplitus.
*Purplitis is not a real disease. Don’t hate on the beets*
This is not uncommon, and it’s important for data visualization.
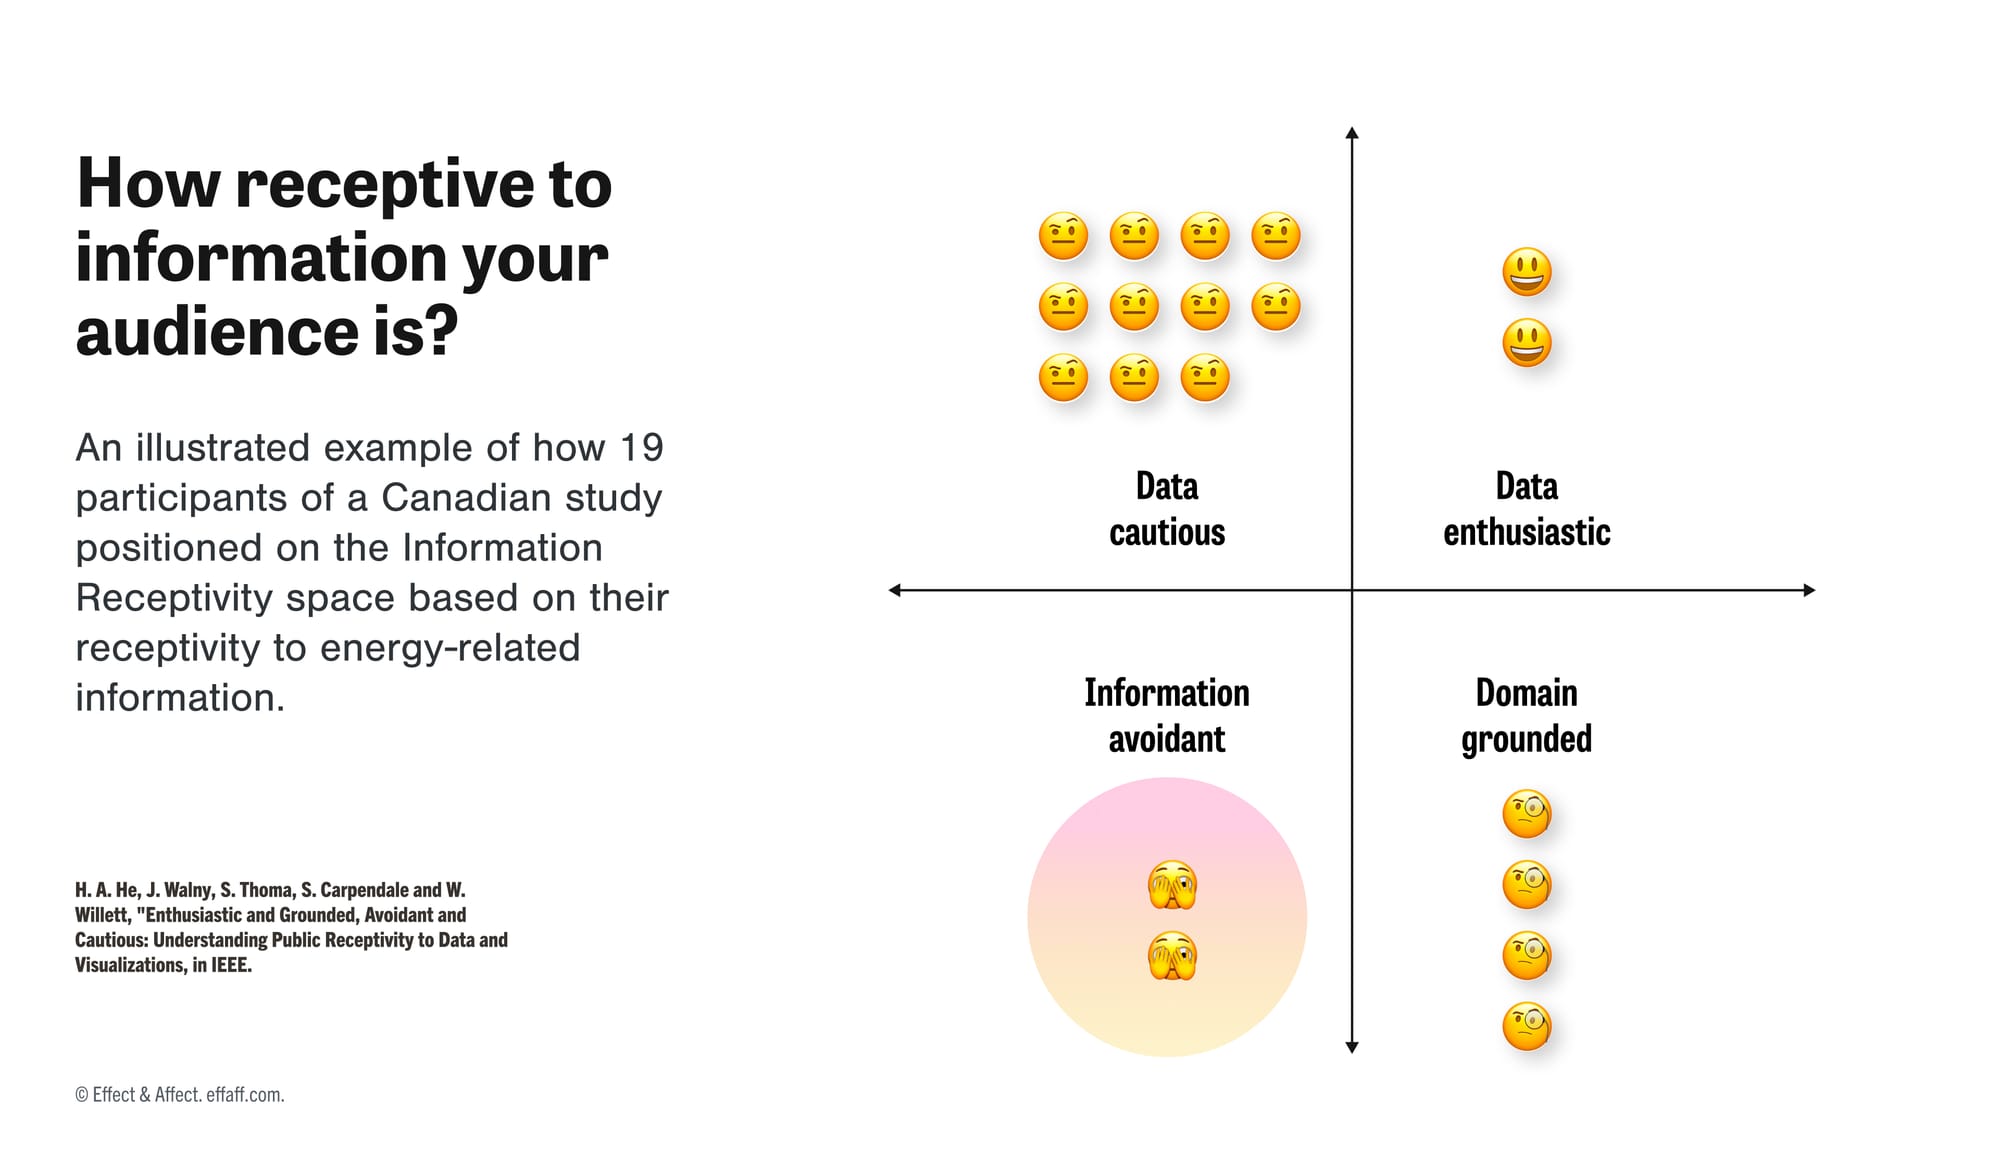
In 2019, researchers at the University of Calgary conducted a study with 19 Canadians from different ethnic, occupational, and demographic backgrounds to better understand how they experienced information on a hot topic: energy in Canada (think anti-pipeline protests, solar energy, and all that good stuff…).
During the interviews, participants were asked about their knowledge of and relationship to energy information, their reactions to data visualizations presented with the questions, and their perceptions of energy-related personas (including the CEO of an oil company, a First Nations Elder, a journalist, a pipeline welder, and an anti-pipeline activist).
Based on their analysis of interview transcripts and videos, the researchers proposed the "Information Receptivity Space," which organizes participants into four clusters:
- Domain-Grounded: Energy experts who were highly receptive to the data itself but not to interpretations outside of their own.
- Data-Enthusiastic: Non-experts who were receptive to data and actively sought help with interpretation.
- Data-Cautious: Participants who were not receptive to the data itself but highly receptive to interpretations from trusted sources.
- Information-Avoidant: Those who were not receptive to data or interpretations, despite caring about energy issues.
Information avoidance is the act of deliberately steering clear of information that might be beneficial but could also cause discomfort, challenge beliefs, or require undesired actions.
So why are people information-avoidant?
Back in 2010, a team at the University of California, Riverside reviewed more than 120 papers across various disciplines, including psychology, economics, communication, and medicine, highlighting the agnostic nature of information avoidance. They found three main reasons for information avoidance:
- the information demands a change in their beliefs:
“I must accept that Beets are not healthy and are killing me” - the information requires undesired action:
“I must beet this addiction to beets” - the information stings emotionally:
“I could regret eating beets for breakfast for the last 20 years”
However, people are not equally likely to avoid information across all circumstances.
In their review, the Californian team identifies four factors that could help moderate the effect of Information avoidance:
- Perceived control over the consequences of information:
“If I read this pamphlet about Purplitis, the information will allow me to take action against this treatable disease." - Resources to cope with the information:
“I brought my nephew with me to the doctor so I feel emotionally supported in this journey." - Ease of obtaining or interpreting the information:
"I found information about Purplitis easily and it’s explained in a way that makes sense to me, so I am willing to listen." - Expectations about the content of information:
"I'm scared the news will be bad, but if there's hope for managing Purplitis, I should probably know about it."
What does this mean for dataviz design?
Presenting information clearly and accurately isn't enough. We must consider psychological and emotional factors that lead people to tune out information entirely.
- Drop the monolithic “general” audience: Research to understand a clear target audience's beliefs, motivations, and potential emotional responses to the information you're presenting. This knowledge helps you tailor your visualizations to be more receptive to different levels of information receptivity
- Soften the emotional landscape: Design your visualizations to be inviting and non-threatening, and avoid sensationalized or alarmist language, like an art installation! Provide context and explanations to help viewers process potentially upsetting information.
- Encourage positive action: Focus on the positive steps that can be taken based on the insights provided in your visualizations.
- Use baby steps to address belief-challenging information gradually: Use storytelling techniques to guide viewers through the data, helping them to see the connections and implications of the information. Provide supporting evidence to help them process and accept the new information.
- Create a safe space for exploration: Allow users to control the depth and pace of information presented in your visualizations. Provide options for users to explore the data at their own comfort level.
- Build trust by being trustworthy: Be transparent about the data sources, methods, and limitations of your visualizations. Providing this information can help build trust with your audience, particularly those who may be skeptical of the information presented.